Intrapartum AI
Built a childbirth prediction model that improves on earlier studies of caesarean risk.
- Role
- Modelling and app, end to end
- Where
- Kasturba Medical College, for OBGYN residents
- Year
- 2024
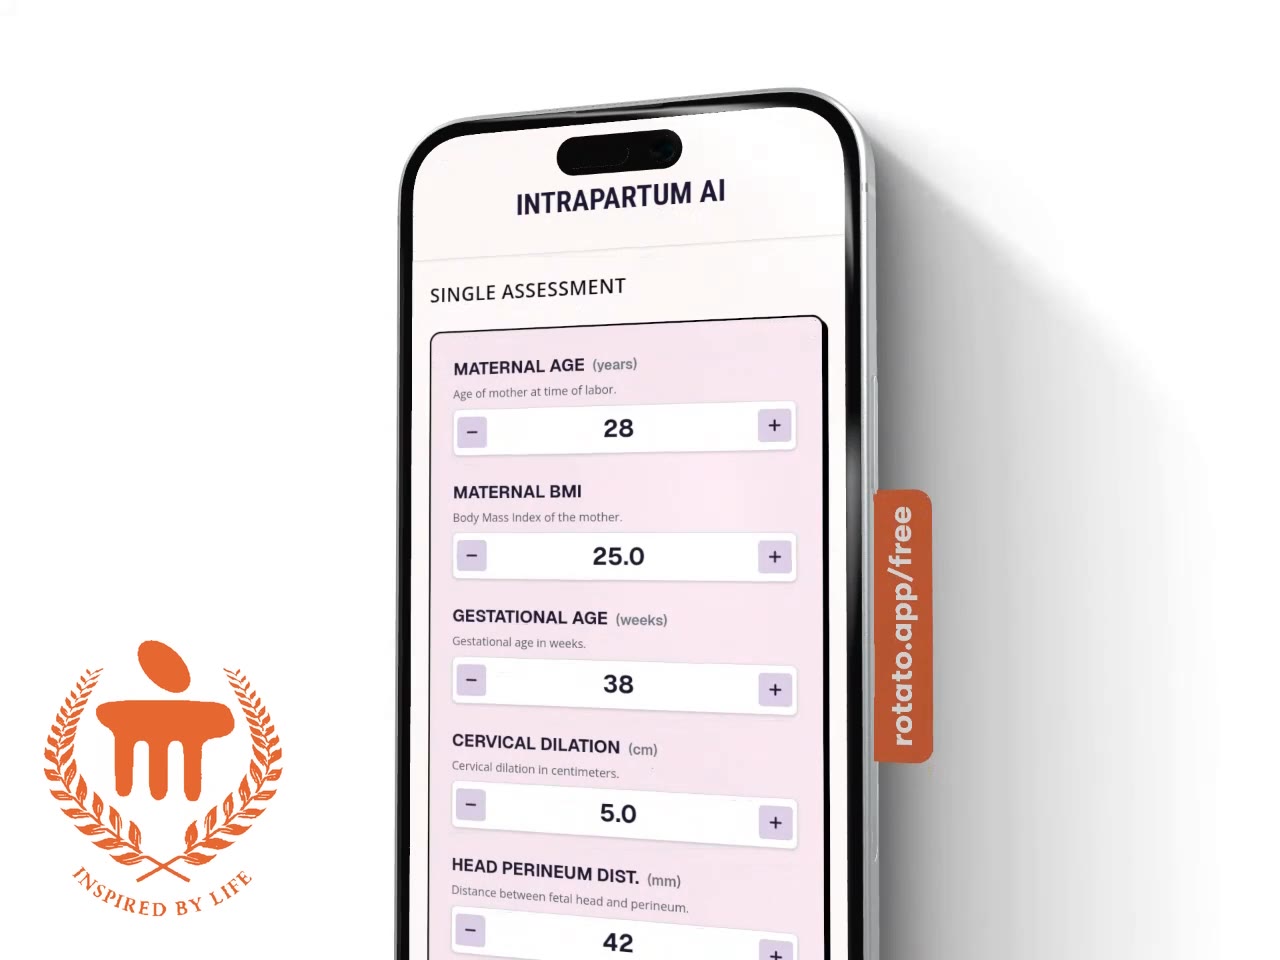
A clinical model that predicts difficult childbirth outcomes, reaching 0.97 AUC against a baseline of 0.853.
How it started
OBGYN residents at Kasturba Medical College wanted to further develop a clinical model and test its utility in the wards.
The idea was to predict childbirth outcomes from measurements taken during labor.
Their research built on Eggebø et al. (2015) for the model, and Usman et al. (2019) for the app.
The first version
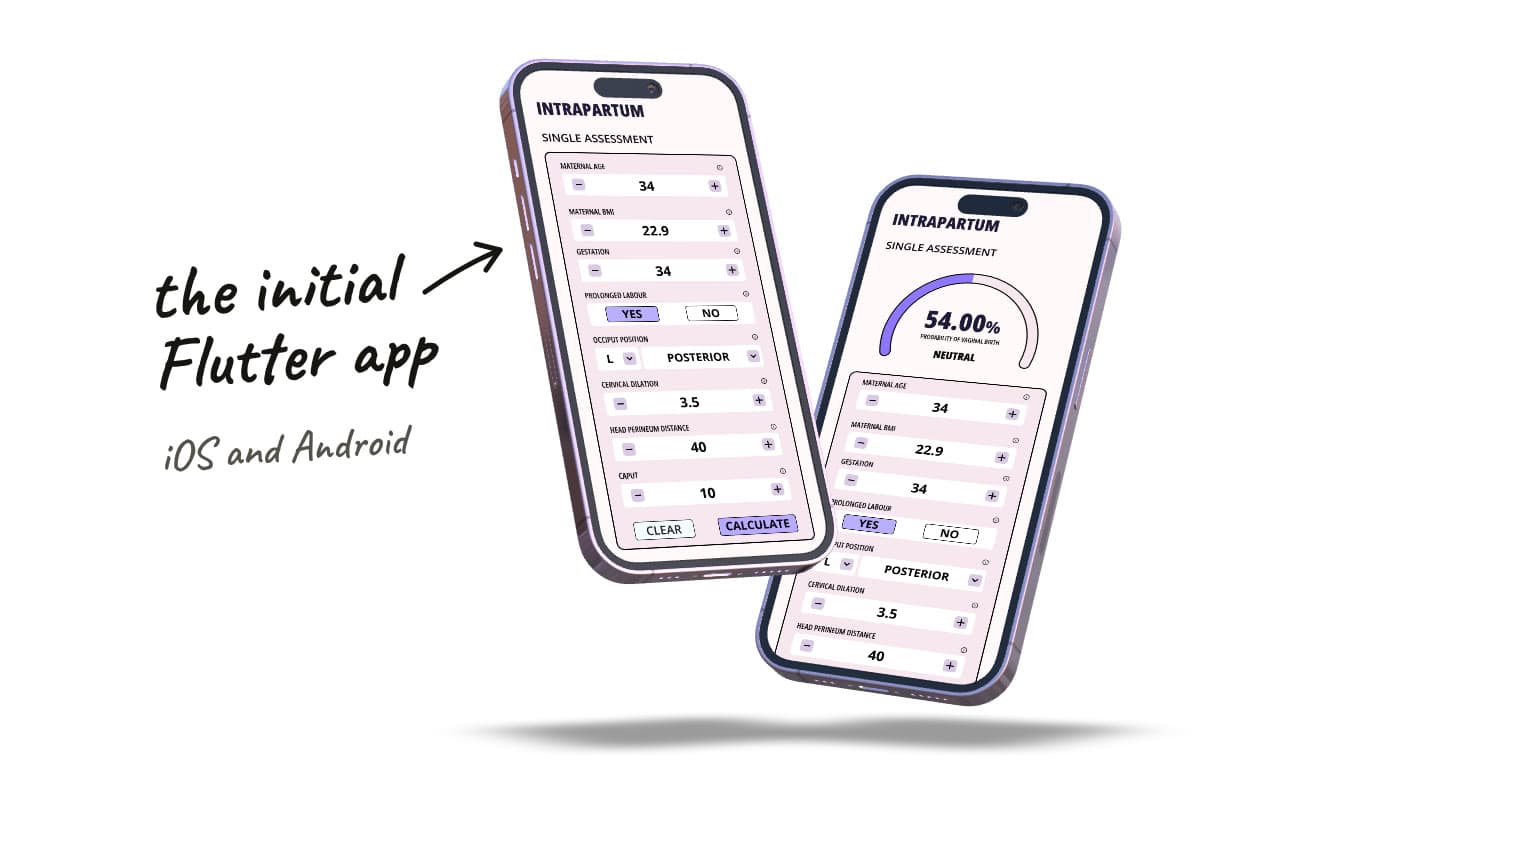
The first version started as a Flutter app that replicated the original model. It was built straight from the parameter coefficients published in the reference paper.
This gave us a starting point for the user interface, and made the model easier to evaluate in real-life scenarios.
Later versions moved to a Next.js web app on Vercel, so there were no app store listings to maintain.
The new parameters
To develop the model further, the residents wanted to add new parameters, starting with angle of progression.
The published paper did not open-source the dataset it was trained on. So a new dataset was collected and cleaned specifically for this model.
A new model was trained from scratch on it, with two changes over the original:
- Standardized inputs, so no single measurement outweighs the others because of its units.
- A better training setup: balanced class weights and stratified 5-fold cross-validation.
Result
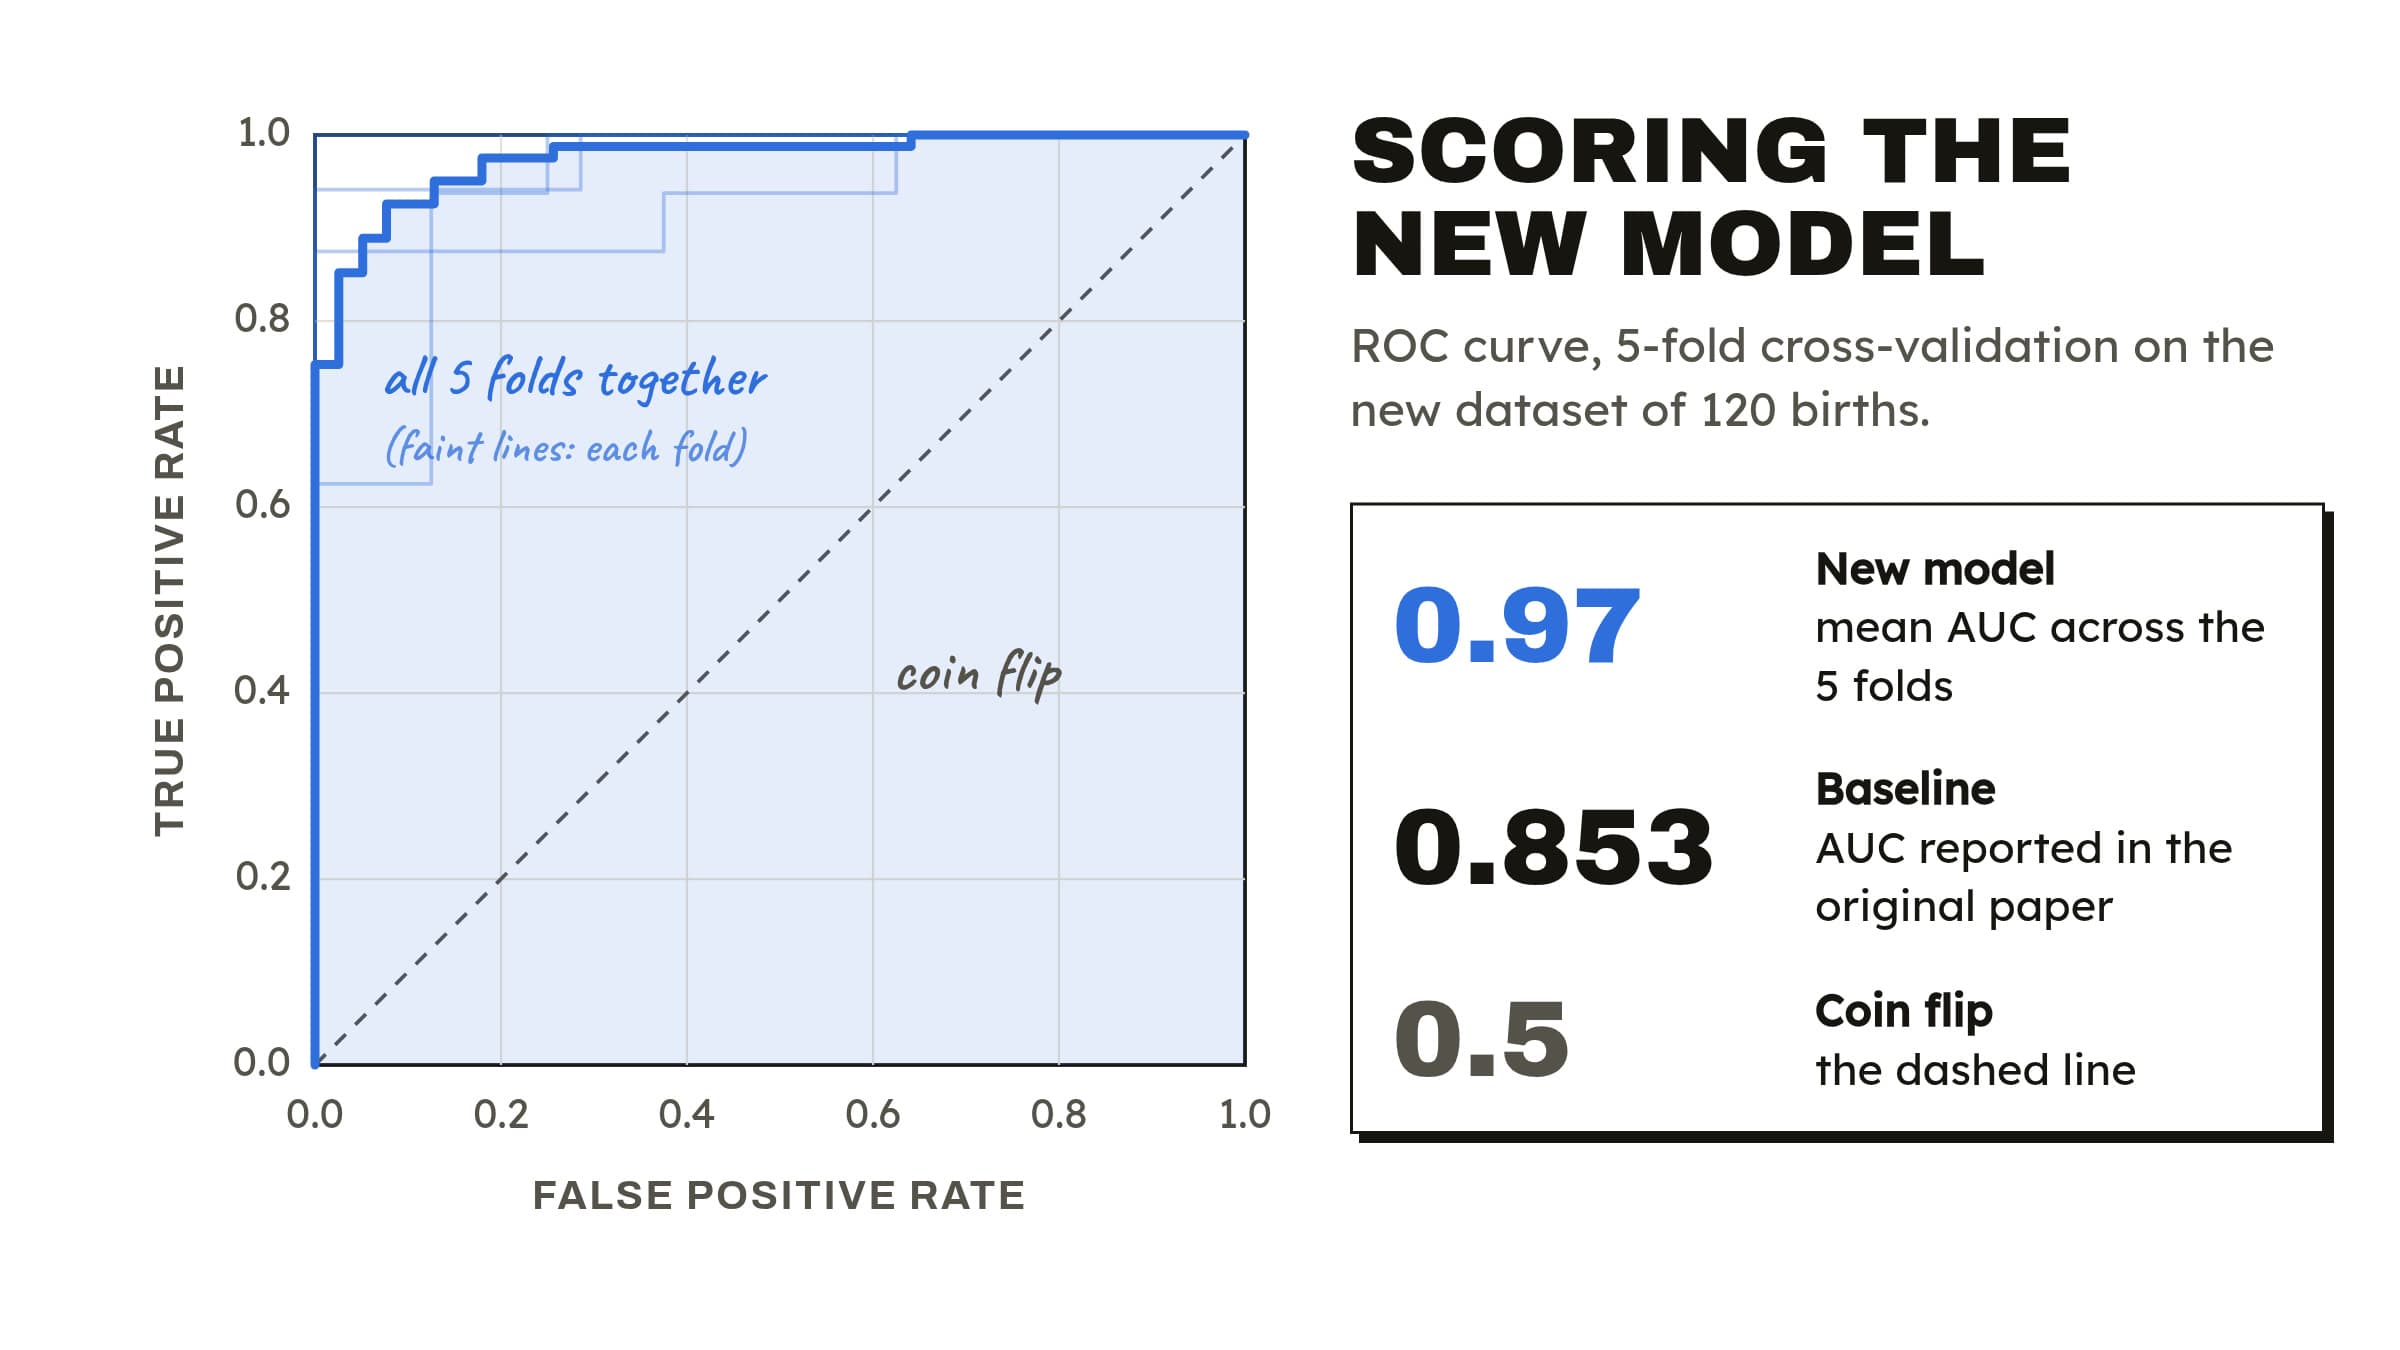
Together, these took the model from a baseline of 0.853 AUC to ~0.97.
It now runs as a live web tool the residents can test and use in the wards.
✱ how was this measured?
How it was measured
The model was scored on the residents' new dataset.
- AUC: how well the model tells apart cases with and without a difficult outcome (1.0 is perfect, 0.5 is a coin flip).
- 5-fold cross-validation: the data was split into five parts. The model trained on four and was tested on the fifth, five times over, and the scores were averaged.
- Baseline: 0.853 is the AUC reported in the original paper, on its own data.
I learned…
how to turn a research paper into a working tool.